How Multicollinearity Ruins Your Media Mix Model
Multicollinearity makes MMMs unreliable by preventing accurate channel attribution. When variables move in lockstep, you can't distinguish individual contributions, leading to budget mistakes. Learn to identify and fix it using VIF scores and correlation analysis.
Excerpt
Modern marketing programs are quickly adopting advanced measurement techniques like media mix modeling (MMM), which uses regression analysis to measure the contribution to sales of each marketing activity, promotion, and macro-economic event. It is a dream tool for every marketer who has the tricky job of distributing budgets cost-effectively while delivering on growth goals. While it is easy to blindly trust the black box MMM solutions data scientists have built, all it takes is an inaccurate model and one wrong decision to have your marketing strategy unravel. This outcome is prevalent, and I have inherited many scenarios where marketers were making decisions on poorly built MMMs. As a marketer, I believe we have a responsibility to understand how these models work, question their validity and accuracy, and provide the necessary business knowledge to make the model as accurate as possible. To help educate marketers, I will explore a critical issue that affects every MMM: multicollinearity.
MMM Primer
Before diving into multicollinearity, let’s cover the basics for those who are unfamiliar with MMM. At its core, Media Mix Modeling, using a frequentist technique (most common), is a multiple linear regression model. A statistical model that predicts one outcome (dependent variable) based on two or more predictor variables (independent variables), assuming a linear relationship between them. The model’s objective is to find a line of best fit through the data, revealing each predictor variable's contribution to the outcome. In marketing, predictor variables are commonly channel spend (Meta, Google, CTV, etc.) and key marketing events (promotions, product launches) with sales as the outcome being predicted. It answers the common marketer question, “How much did each dollar spent on a given channel contribute to my sales?”.
Where Positive Metrics Hide Bad Models
When you run an MMM, you evaluate it based on using a common set of metrics: Adjusted R-Squared, Root Mean Squared Error (RMSE), Mean Absolute Error (MAE), and F-Statistic. The problem with these metrics is that they can be misleading when predictor variables have complex relationships with each other. Adjusted R-Squared is traditionally viewed as the high-level accuracy gauge of the model, where 0 means there is no relationship between the predictors and the outcome, and 1.0 is a perfect fit, meaning your predictor variables perfectly explain the changes in sales.
Something to be aware of with this metric is that it can be common with MMMs to see an Adjusted R-Squared value jump from 0.5 to 0.9 simply by adding more predictor variables, even if they don’t provide independent insights. This scenario often signals multicollinearity, when two or more predictor variables in your regression model are highly correlated with each other. The model may predict sales accurately overall, but you can’t reliably determine how much each predictor variable contributed. Defeating the purpose and intention of having an MMM.
What Causes Multicollinearity in MMMs
Multicollinearity in MMMs stems from several common sources:
- Strategic Decisions
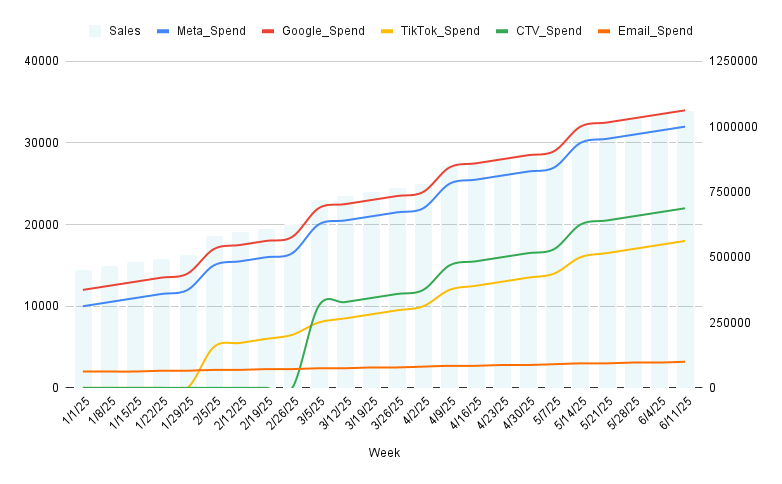
- Overlapping channel launches and budget allocation patterns - Launching multiple channels simultaneously or deploying budgets in lockstep across channels, making it impossible for the model to distinguish the individual effects.
- Channel relationships - Overlapping audience exposures across paid channels, similar response to awareness efforts, retargeting targeting, and coordinated funnel strategies where upper-funnel activity influences bottom-funnel performance.
- External Factors
- Seasonality and Timing Patterns - Seasonality, day-of-week trends, and economic conditions drive multiple channels to perform similarly simultaneously, creating correlations even when they aren’t directly related.
- Tactical Overlaps
- Product changes - New product launches, features, and updates can lead to identical performance patterns across all channels simultaneously.
- Data issues
- Tracking issues - Measurement gaps or inconsistencies.
- Insufficient variation - Limited variation in spend levels.
- Limited historical data - Limited historical data can reduce the ability to detect individual contributions.
How Multicollinearity Impacts Marketing Strategy
When multicollinearity is present in your model, it has consequential outcomes for your marketing strategy.
Budget Misallocation
Budget decisions are the most direct action taken from an MMM read-out and the first place to be misguided. When your model can’t accurately distinguish between individual channel contributions, many wasteful investment decisions can be made, like over-investing in poor-performing channels, and even more impactful, reductions in investment in your top-performing channels.
False Optimization
Marketers optimize their channel mix based on MMM read-outs. If the decision-making is coming from a model that isn’t reflecting reality, then overall performance will take a hit. Beyond channel mix, you will make misguided tactical and even operational decisions like targeting the wrong audiences, producing the wrong creative, and even hiring the wrong specialists.
Broken Forecasting
Financial planning depends on accurate projections. If your MMM is unstable due to multicollinearity, your revenue forecasting will be unreliable. This leads to a loss of confidence in the marketing department's credibility and limits your ability to secure budget for growth initiatives.
Leadership Confidence
The most damaging impact from multicollinearity is the loss of leadership trust in the model. I have witnessed early MMM failures due to multicollinearity, leading to abandonment in models. The methodology gets blamed, the investment in the model becomes a sunk cost, and the organization loses years of potential positive optimization due to a fixable model problem.
How to Evaluate Multicollinearity
While comprehensive statistical checks should be run on any MMM there are two metrics that give you the clearest view into multicollinearity issues, VIF Score and correlation matrices.
- Variance Inflation Factor (VIF) - Measures how much of a predictor variable’s coefficient is inflated due to being correlated with other variables.
- Formula =
1 / (1 - R^2) - Scale
- 1 = No correlation with other variables
- 5-10 = Moderate multicollinearity with other variables and should serve as a warning with further investigative work conducted.
- >10 = Significant multicollinearity and action should be taken before trusting channel coefficients.
- Formula =
Example
- Correlation Matrix - Measures multicollinearity between pairs of predictor variables in one grid. It reveals the specific pairs that are moving together.
- Scale
|r| >= 0.7and<= 0.8= High correlation and a potential cause for concern.|r| >= 0.9= Very high correlations and a significant concern.
- Limitation
- Relationships between three or more variables cannot be evaluated.
- Scale
Example
How to Fix Multicollinearity
Multicollinearity doesn’t mark the end of your MMM; several approaches that can be taken to address it.
Modeling Techniques
Regularization techniques like ridge regression or lasso regression constrain coefficient estimates, preventing unstable results when predictors are correlated.
Independent Variation
Creating true independent variation through incrementality experiments using synthetic control methods or market match techniques can be used to isolate the impact of individual channels. The experimental data can then be used to validate the MMM coefficients.
Variable Consolidation
When channels consistently move together, consider combining them into a single variable to improve the accuracy, and then run incrementality experiments to split them out moving forward.
Variable Removal
The most drastic, and last resort, is to remove the variable causing severe multicollinearity. Be careful with this action, as this acknowledges that you cannot reliably measure the channel’s independent contribution.
Be an Informed Stakeholder
Running an effective marketing program does not require you to become a statistician; it requires you to be an informed stakeholder who asks the right questions. As advanced measurement techniques become like MMM become commonplace in marketing, you need a working understanding of how they function, the confidence to challenge assumptions with your business expertise, and the ability to marry the outputs with action. Multicollinearity is just one of the many technical issues that can undermine your MMM, but also one of the most common and fixable. Understanding it transforms MMM from a black box to a transparent tool that you can trust with your biggest strategic decisions.