Google Tag Manager Debugging Tools
One of the most important, yet commonly overlooked portions of the Google Tag Manager (GTM) creation process is debugging. It is the final step before your hard work tracking data points pays off and the last thing that anyone wants to invest time in. Commonly referred to as quality assurance or QA’ing, this step in the tagging process requires repetitive mundane tasks to ensure that every possible user experience scenario is tested for and data consistency is validated. Hate it or not, the qual
Excerpt
One of the most important, yet commonly overlooked portions of the Google Tag Manager (GTM) creation process is debugging. It is the final step before your hard work tracking data points pays off and the last thing that anyone wants to invest time in. Commonly referred to as quality assurance or QA’ing, this step in the tagging process requires repetitive mundane tasks to ensure that every possible user experience scenario is tested for and data consistency is validated. Hate it or not, the quality of your effort in this step will make or break your reporting and data quality. In the following guide I will introduce you to four tools that will make the debugging process as seamless as possible and guide you toward the rewarding experience of publishing your container version error free.
Google Tag Manager Preview and Debug Mode
How to Access: Google Tag Manager - Preview Mode
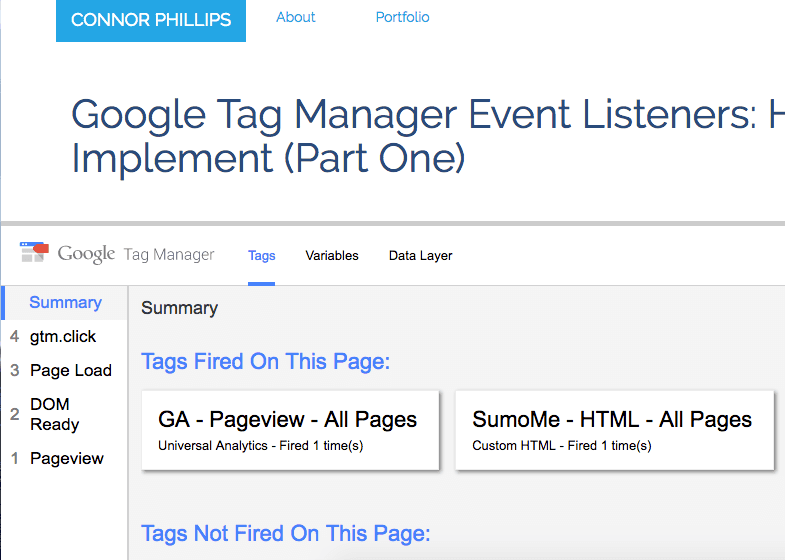
The preview and debugger mode is GTM’s built-in console that logs the individual tags, triggers and variables that are firing with each page load and on-page event interaction. The console is broken out into two parts; A summary side-bar listing all of the on-page events in chronological order and a large console window displaying detailed information about the tags, triggers and variables associated with each event.
This testing tool is the most utilized out of all of the tools in this guide and provides you with almost all of the information that you need to debug every error scenario that is possible. The only drawback to this tool is its lack of ability to track transitional events from one page to the next. This scenario commonly happens when users are sent to an outbound domain or a new page is loaded faster than the console can display events firing from the previous page. In these scenarios, it is best if you use other tools to track your setup.
Developer Tools (Network Tab)
How to Access: Browser Specific Developer Tools Console
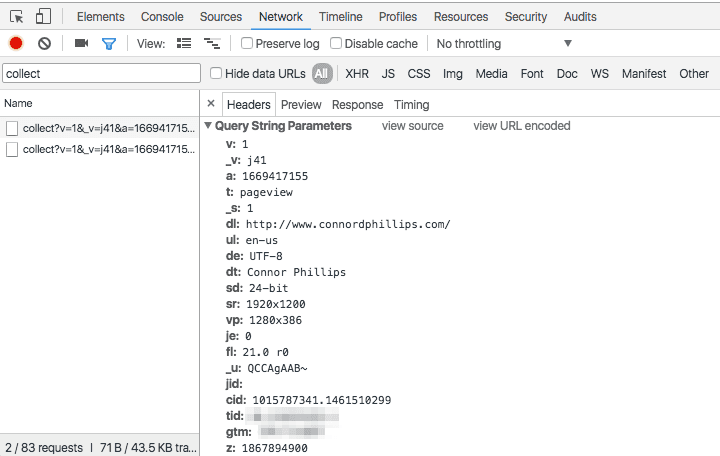
The network section of your browser developer tools is the best way to track if pixels are firing and sending cookie information correctly to the Google Analytics (GA) server. With each pixel hit that occurs on a page, the network tab logs the pixel and the cookie information that is being reported to GA. The detailed information found in the cookie allows you to identify improperly labeled or null values that are appearing in your Google Analytics reports, as well as any server timeouts that are preventing the communication of your data. If you ever run into a scenario where a pixel is not appearing when it should be, then there is most likely an issue with your trigger setup.
Google Tag Assistant (Record)
How to Access: Download the Chrome extension here: Google Tag Assistant
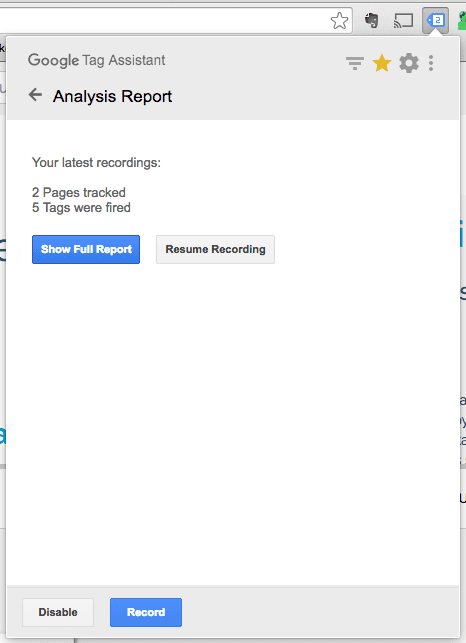
The newest debugging tool on the market that was unveiled at the Google Analytics Summit a few years back is the Google Tag Assistant Record feature. The Google Tag Assistant Record feature identifies and logs all of the tags, triggers and variables that are accessed within a recorded user flow. Once a recording is complete, the logged data is put through numerous tests and and compiled into a comprehensive report that helps with validating the accuracy of the data and any tracking issues. This has quickly become a must have tool to track those tricky situations that the Preview and Debug mode cannot catch.

Browser Console
How to Access: Consult your browser documentation
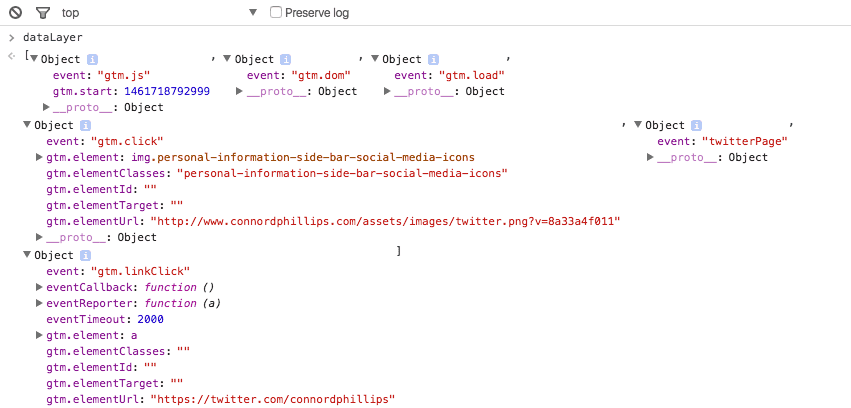
Using your browsers console is most advanced and rawest form of debugging a GTM setup. This technique has become a bit dated with the advancements in the Google Tag Manager debugging tools, but it provides you with the raw form of the values that are being pushed to the dataLayer variable. All you have to do to access this information is type "dataLayer" in the browser console and you should receive a response with at least three objects. If you receive an error than the GTM library has not been loaded and something is wrong with your container tag.
The three objects that appear by default are gtm.js (GTM javascript library that is pushed when loaded), gtm.dom (pushed when the DOM is available) and gtm.load (pushed when the page is loaded). After those three objects you may see numerous objects depending on how many interactions with the dataLayer have taken place at the time of calling the variable. Within these objects are properties with values gathered by the dataLayer variable about information on that specific page. For the most part, this is the same information that is being displayed on the dataLayer tab within the GTM Preview and Debugger tool, but I highly recommend you try out this technique to get a better understanding of how on-page information is being communicated to the container tag.