Geo Experimentation A Popular Approach to Incrementality
Incrementality is an important measurement approach to evaluating the impact of a marketing effort. Through the use of experimentation, incrementality can identify conversions that wouldn’t have occurred without the introduction of a marketing effort. This valuable piece of information helps to prove the efficacy of your marketing in a way that is not measurable with commonly used attribution reporting and serves as an additional data point to justify your marketing decisions. While impactful, i
Excerpt
Incrementality is an important measurement approach to evaluating the impact of a marketing effort. Through the use of experimentation, incrementality can identify conversions that wouldn’t have occurred without the introduction of a marketing effort. This valuable piece of information helps to prove the efficacy of your marketing in a way that is not measurable with commonly used attribution reporting and serves as an additional data point to justify your marketing decisions. While impactful, it is a more complex type of measurement than most attributable reporting due to the unpredictable nature of experimentation and the need for statistical models. Despite this complexity, the general concepts associated with this marketing topic shouldn't be foreign to marketers, and in the rest of this article, I will provide a high-level explanation of incrementality experimentation, as well as the popular approaches used with geo experimentation.
Incrementality through Experimentation
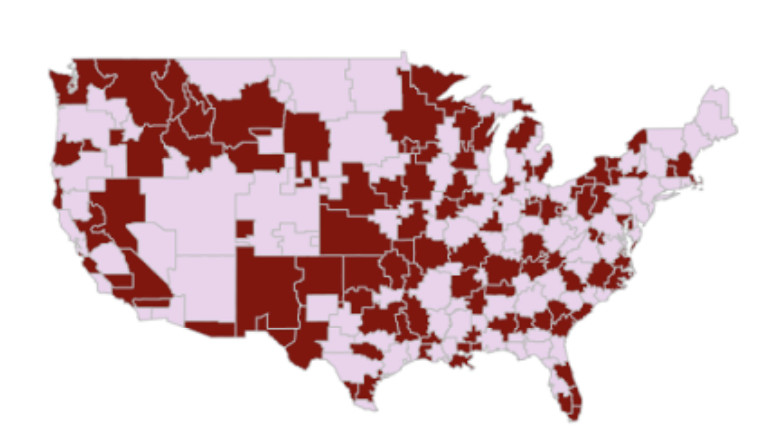
The golden standard of experimentation-based incrementality measurement is Randomized Controlled Testing (RCT). This method randomly assigns individuals to control and treatment groups in a rigorously controlled environment. While one of the most accurate approaches to measuring incrementally, for most organizations, this isn’t a possible option due to how expensive and difficult it is to adhere to the requirements of the method. A more accessible experimentation method, and the focus of this article, is geo experimentation. It has quickly become the popular approach to measuring incrementality for marketers, utilizing aggregated users segmented by their generalized geographic location to create control and treatment groups. This method has minimal data requirements (most companies likely have the data on hand), and its use of aggregated users is privacy-centered putting many at ease.
The process of running a geo experiment is also a lot less time and resource intensive, and can be summarized in four steps:
- Determine your test setup and in the process, select if you will be running a test with ads on or off (inverse test) for the treatment group.
- Run simulations on pre-treatment data to arrive at statistically/business-accepted control and treatment groups.
- Select your groupings and run the test.
- Analyze the results after the test is run, or after a cool-down period directly after the test (recommended).
The success of the experiment is based on the results of the difference between two testing groups (i.e. the lift or incrementality of the test), and statistical tests used to validate that the test is statistically significant. In this article, my focus will be on introducing the three most popular geo experimentation methods (as of the time of this article being published), with relevant links that will allow you to go deeper on the topic.
Synthetic Control Method (SCM)
Library (Meta uses the extension, ASCM): Meta’s GeoLift library
Whitepaper: Synthetic Control Methods For Comparative Case Studies
The Synthetic Control Method is a modern statistical experimentation method that was originally used for evaluating policy and regulatory manners but has recently seen rapid adoption by advertisers to measure incrementality. This method uses geographical information to create control and test groups based on the best grouping of multiple locations from untreated data to create a counterfactual that closely mirrors a treatment group for the same data.
The counterfactual is what we would have observed if the marketing campaign had not run during the test. Given that is very unlikely that a geographical location by itself will mimic the behaviors of the treatment, the model uses a combination of differently weighted geographical areas to create a synthetic grouping that aligns with the behaviors of the treatment group when creating the counterfactual. This synthetic grouping helps to create a balanced test setup, that will help improve the predictability of what is expected during the test, and a higher likelihood of achieving statistical significance.

After the control and treatment groups have been established, and a test has finished, the results during the intervention are measured for statistical significance, and a treatment effect (i.e. lift effect). Depending on the type of advertising, a cool-down period might be added to the end of the intervention to account for advertising adstock. The treatment effect is determined by taking the difference between the treatment and the synthetic control during the period of intervention. The results are typically communicated in unit difference, percentage change, and incremental unit cost. However, these results should not be trusted without validation as they might be random, and not reproducible, which would not be helpful for any decision-making process.
Statistical significance must be evaluated to ensure the validity of this test result. Factors like effect size, holdout, power, confidence intervals, and p-value, are measured and compared to arrive at a verdict for statistical significance. While arriving at a statistically significant verdict should make you feel confident in the test results, you should be aware of outside factors (e.g. unaccounted media running in control areas) that might influence these results and should be accounted for when interpreting the results.
Augmented Synthetic Control Method (ASCM)
Library: Meta’s GeoLift library
White Paper: The Augmented Synthetic Control Method
The augmented synthetic control method (ASCM) is an extension of the SCM method. Among the modifications to the original method is the addition of covariates to help improve the test setup and reduce biases, and negative weights in the weighting system. While these additions help add more flexibility and customization to the method to adhere to your business needs, using covariates without careful consideration could end up doing the opposite and introducing bias, so proceed with caution. The process and evaluation of using this method follow the approach described in the SCM section.
Matched Market
Library: Google’s Matched Markets
White Paper: Estimating Ad Effectiveness using Geo Experiments in a Time-Based Regression Framework
The matched market method is a very customizable approach based on different algorithms, like hill climbing, as well as user-defined covariates like geographic targeting, budget limitations, and other business considerations. The focus of matched market testing is selecting a control and a comparison group that resembles the treatment group with the goal of minimizing randomization through the previously mentioned inputs. This approach is a contrast to SCM and ASCM, which rely on a synthetic counterfactual to create the grouping. Depending on the algorithm used, the approach, and the criteria used to create matching groups the pre-treatment data will be different. However, it is similar in the process and statistical evaluation with SCM and ASCM, with the exception of evaluating the control against the comparison group rather than a synthetic counterfactual.
What Method Should I Use?
There is no right or wrong answer here. Each method has its own defining characteristics, with one that might fit your test setup requirements better than another. You also have the ability to combine methods to utilize certain features found in one and not the other to optimize a test design for your unique case. For example, you can start with using ASCM to build a synthetic control group, and then use matched market techniques like stratified matching to fine-tune the setup selection. A case like this is very advanced, and typically beyond the scope of requirements for how most of your tests will be run.
For most cases, there shouldn’t be a focus on choosing the “right” method, but rather on defining the objective, understanding your data, and applying the proper transformations where needed that will have a substantial impact on the outcome of the success of the test design. Play around with different libraries for different tests, and compare the results to see what method fits better with the data you are working with. You likely won't have a perfect test design the first time you try, so don't feel discouraged and understand that this is an iterative process that will improve the more you experiment.