Creating and Automating Google Analytics Reports in Google Sheets
Manually populating spreadsheets with Google Analytics data on a weekly or daily basis is a time consuming task.The typical report building format follows the uniform process of generating a custom report, exporting that data to an excel format and then pasting the values into a customized reporting format. This is a pretty common practice that results in a major waste of time and resources for companies of all sizes. In order to avoid this process and regain the time and resources that are lost
Excerpt
Manually populating spreadsheets with Google Analytics data on a weekly or daily basis is a time consuming task.The typical report building format follows the uniform process of generating a custom report, exporting that data to an excel format and then pasting the values into a customized reporting format. This is a pretty common practice that results in a major waste of time and resources for companies of all sizes. In order to avoid this process and regain the time and resources that are lost, exploration of an automated solution has to be a high priority. Thankfully there is a readily available solution for Google Analytics users within the Google Sheets Add-On gallery.
The Google Analytics plugin for Google Sheets is a free add-on that provides users of all skill levels with the ability to pull and automate Google Analytics data into a spreadsheet without needing any technical prowess. This automated process eliminates the need to go through the Google Analytics web application to pull custom reports and utilizes Google Analytics API calls, which lifts reporting restrictions that occur when pulling data through the web application.
Examples of Web Application and API Call Reporting Differences
-
Dimension Use:
-
Web Application = 5 dimension slots
-
API = 7 dimension slots
-
Rows Available:
-
Web Application = 5,000 rows
-
API = 10,000 rows
Outside of bypassing web application restrictions, the plugin is a great way to remove reporting grunt work like trying to pull month over month data when your account contains sampling, as well as scheduling reports to be pulled on an “N days ago” basis.
I plan on going through specific use cases in future blog posts, but for the purpose of this article I will only be focusing on a step by step tutorial for setting up and using the tool.
Step by Step Guide
Part 1: Installing the Google Analytics Plugin for Google Sheets
1) Create a new Google Sheet or open up an existing Google Sheet
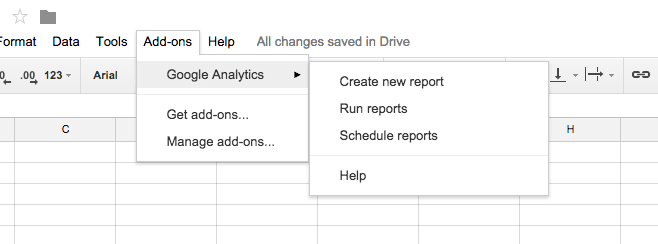
 **2)** Locate the “Add-Ons” drop down from the navigation and click “Get add-ons”

- ”Add-Ons” is Google’s gallery of Google Sheets plugins that can be downloaded and used with the spreadsheet platform. There are a lot of cool plugins that people have built to help make your life easier, so I highly suggest scanning through the library and playing around with a few of the plugins.
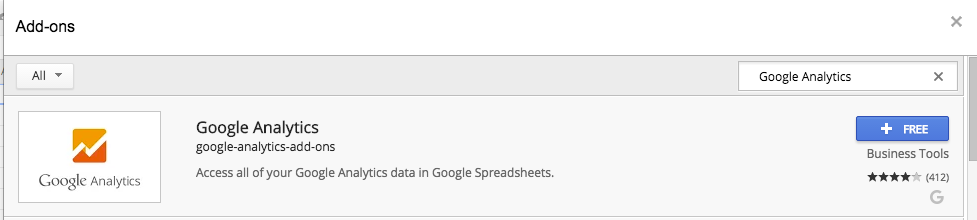
3) The plugin you are looking to install is titled “Google Analytics” and the publisher is Google.
This plugin can be found in either the featured section of “Add-Ons” or by searching for “Google Analytics” in the search bar. Click “+ Free” once the plugin is found.
4) You will be directed to an Oauth popup that will require you to enter your Google account credentials. Enter your credentials and then click submit. When you are sent to the permissions screen, click “Accept”. The permission states that upon approval, Google Sheets will be granted access to any data from the Google Analytics accounts that are associated with your Google account.

Part 2: Creating the Reporting Format
5) Click “Create new report” to open up a reporting template sidebar. Within this sidebar you will notice three sections, “Name Your Report”, “Select Account Information” and “Choose Metrics and Dimensions”.
6) Fill in the “Name Your Report” with a title that best describes the type of data that is being pulled.

7) After naming your report, select the appropriate account, property and view combination that will point your API request to the correct source of data.

8) Choose the dimension and metric combinations that will give you the data you need for your report. As you type in values, you will notice that there is an auto-populate dropdown that is displayed. This is extremely helpful when you don’t remember all of the dimensions and metrics off hand. After adding the dimensions and metrics you want for the report, click “Create Report”.

Important Note: When you are trying to use dimensions and metrics that contain slot numbers like “custom dimension 3” or “custom metric 4”, you will be given a label that contains the name of that dimension or metric and “XX”. This is a placeholder value that must be modified with the correct slot number for your field after the report is created. If this is not done, then you will receive an error message when running the report.

9) After clicking “Create Report”, a report tab will be generated labeled “Report Configuration”. This tab contains the reporting criteria you selected from the sidebar wizard as well as a few additional fields that are filled by default. I will briefly describe what each field on this tab means, but I encourage you to look at the documentation to get a deeper understanding of what the fields are and what values can be used.
 **Fields:**
- Report Name - Custom name for the report
- Type - Predefined reporting type
- View - The raw unique ID of your view
- Start Date - Start of data range
- End Date - End of data range
- Last N Days - Data range that is based on days since day the data is pulled
- Metrics - Reporting metrics in the raw API format.
- Important Note: This is the only format that this tools accepts.
- Dimensions - Reporting dimensions in the raw API format.
- Important Note: This is the only format that this tools accepts.
- Sort - Ability to sort data in ascending or descending order based on a metric or dimension
- Filters - Custom filters for reporting data. This value must be in the raw API format.
- Important Note: This is the only format that this tools accepts.
- Segment - Custom segmentation for reporting data. This value must be in the raw API format.
- Important Note: This is the only format that this tools accepts.
- Sampling Level - Ability to set a sample size for the data being pulled.
- Start Index - Ability to set a starting row within the data table to pull the data from.
- Max Results - Ability to set the maximum amount of rows that can be displayed in the report. The maximum amount of rows that you can pull with this tool is 10,000.
- Spreadsheet URL - Ability to set a destination Google Sheet location for the reporting data to be saved to once the report is run.
Part 3: Run the Report
10) Once you have adjusted the reporting format to your liking, go to Add-ons > Google Analytics and click “Run reports”. After clicking “Run reports”, you will then notice a modal window appear informing you if your report was generated successfully or if it had failed to generate. If the report fails to generate, you will be notified of where the error occurred within your report fields.


11) Upon successful generation, you will see a new tab labeled with the name of your report and within that tab you will see the data from your account that fits your reporting criteria.

Important Note: Every time you click “Run reports”, the tab containing data from the previous report generation is overwritten by default and any adjustments made to the reporting template will take effect during that API request. This is good to know especially if you are using the “Last N Days” field, which provides data for the “N” days since the last time the report was run.
Part 4: Schedule the Report
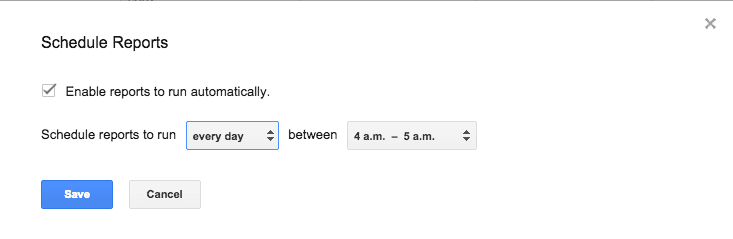
12) Schedule your report(s) to run on specific days and frequencies by clicking on the “Schedule reports” button and adjusting the fields to your preference. You have the option to run the reports during specific hour ranges and for frequencies of hour, day, week and month.

This concludes my breakdown of the Google Analytics for Google Sheets plugin. I hope that the discovery of this tool will make life easier for you by automating your most time consuming reporting tasks. From using this tool for over a year, I can safely say that it has made my life easier by condensing the six hours a day that I spent generating reports into five minutes. I’m sure you will have a similar experience after getting comfortable with the tool and I only ask that you share your experience with other co-workers to make their lives easier. Automated reporting is extremely important for running a lean business, so don’t keep tools like this one to yourself!