Better Data Reporting Practices - Benchmarks, Cell References, Notes
A continuation of part one, Better Data Reporting Practices - Gridless, Grouping, Layout Direction. Use Benchmarks This tip should be a given, but if you are not comparing your performance against some historical time series or relevant benchmark metric, then there will be no way for you to understand if your business is growing or shrinking. The decision on what type of benchmark you choose should be dictated by the data types being presented in the report. Some commonly used benchmar
Excerpt
A continuation of part one, Better Data Reporting Practices - Gridless, Grouping, Layout Direction.
Use Benchmarks
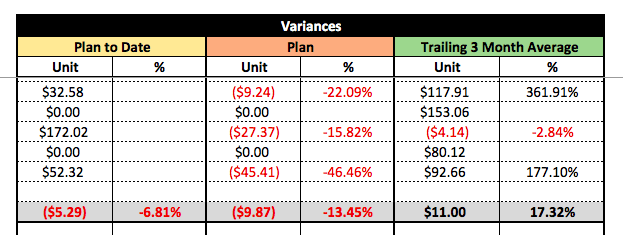
This tip should be a given, but if you are not comparing your performance against some historical time series or relevant benchmark metric, then there will be no way for you to understand if your business is growing or shrinking. The decision on what type of benchmark you choose should be dictated by the data types being presented in the report. Some commonly used benchmarks regardless of the data types being used are planned goals, previous time period or trailing historical averages. Just make sure when you are comparing these data points, that you look at both the unit and percentage variance between the benchmark and observed data, as both of these calculations will indicate the current state of your business.
Reference Cells As Often As Possible
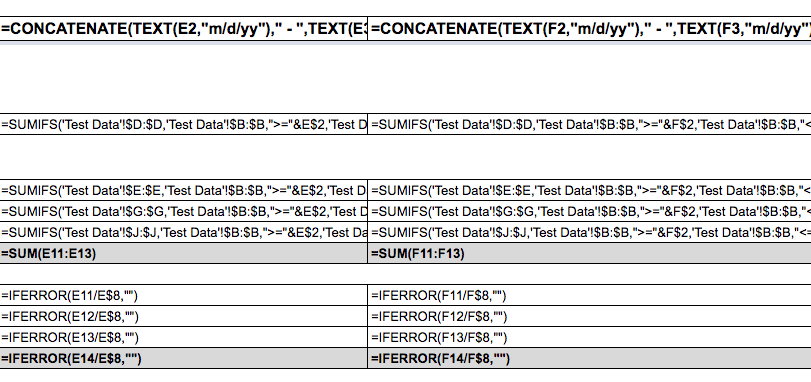
There is no feeling worse than presenting your findings and realizing there are hard coded miscalculated values or that the data varies compared to the what is presented in the data source’s user interface. Both of these issues can cause embarrassment and misguided business decisions, so a good habit to get into is to make your calculation off of a raw data sheet. The raw data sheet will contain all of the records and relevant fields to the overall theme of the report and then you can reference the cells (columns, rows) in that sheet for aggregation functions and individual arrays. This tip might be a little bit more complicated for novice users of Excel because more deeper data analysis will require the use of advanced excel functions like INDEX MATCH, SUMIF, AVERAGEIF and OFFSET, but from my experience, much of the analysis required of you for standard reporting will take place with simple aggregation functions like, SUM, AVG.
Have a Notes Section
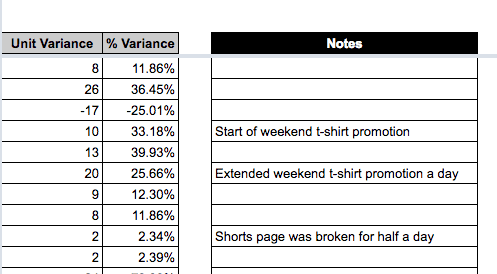
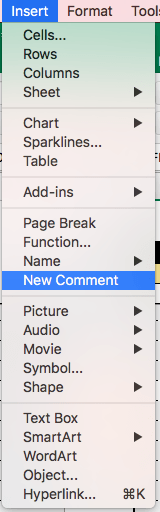
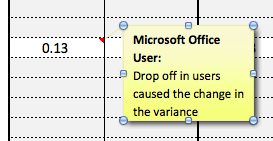
Outliers, performance jumps and dirty data are inevitable when conducting data analysis and while the reported data might not be perfect, the best way to make everyone aware of the reason for a specific trend or issue in the data is with a notes section. A note should be made so that any consumers of the report will quickly understand the what, why and how of that data point. The best way to add a notes section to your report is to add a comment from the “Insert” menu to the cell that stands out. This method adds a textbox that is hidden from view, but exposed when a user places their cursor over the earmarked cell. An alternative option is to add a section of rows or columns along the end of your table that will be used for notes referencing the adjacent cell or column/row where the trend is occurring. This will make your analysis easily accessible when a user navigates through the report.