A Phased Approach to Growth Analytics Architecture
Measuring the impact of growth marketing is complex and a blend of art and science. Unlike other business disciplines where answers can be provided in objective manners like a trail of ledgers, product usage, and customer feedback; Answers to how growth marketing impacts the bottom line are directional, subjective, and influenced by the data on hand. Making the right decisions given the nature of growth marketing measurement lies in individual trust, experience, and the proper measurement infras
Excerpt
Measuring the impact of growth marketing is complex and a blend of art and science. Unlike other business disciplines where answers can be provided in objective manners like a trail of ledgers, product usage, and customer feedback; Answers to how growth marketing impacts the bottom line are directional, subjective, and influenced by the data on hand. Making the right decisions given the nature of growth marketing measurement lies in individual trust, experience, and the proper measurement infrastructure that is rooted in as much science as possible to reduce bias and error. Of the qualities mentioned, I believe that the most overlooked is measurement infrastructure.
When it comes to measurement infrastructure, most organizations rely on intuition and the application of general business knowledge to understand growth performance, when in reality, proper interpretation requires specialized roles and systems. These roles understand the misconception that the full picture can be pulled from ad networks or a product analytics tool as they understand their reporting nuances, limitations, and false pretenses. Growth measurement is more complex than the naked eye lets on and as someone who has seen the space evolve and plenty of organizations take poor approaches to measurement, I felt compelled to share what I believe to be a widely applicable and scalable growth analytics architecture. One that will establish core data and measurement tools that should be considered for your infrastructure, while breaking up the tool adoption into phases that will help to deliver value without imposing costs on your organization before they are necessary.
Phase 1
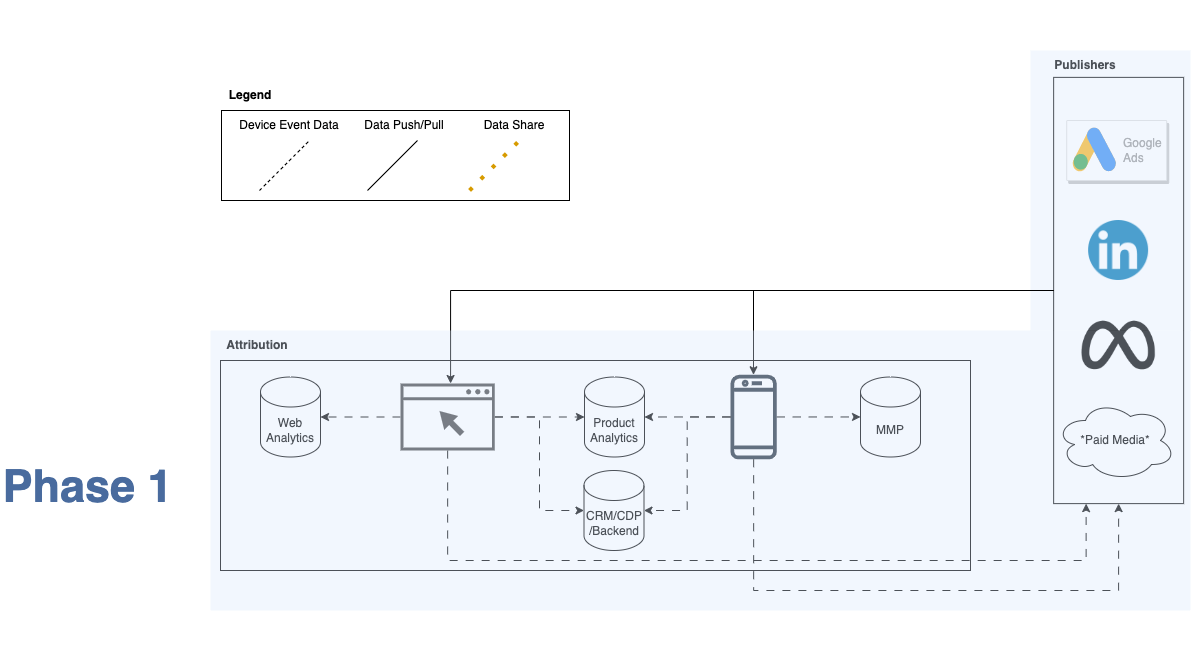
Start with the basics and avoid the urge to jump into incorporating a ton of new tools into your growth analytics infrastructure. The keys to phase one are establishing a baseline tool to measure marketing efforts in a relatively unbiased manner and finding a simple method to unify the metrics from your various growth channels. Neither tasks require SQL or statistical techniques to achieve and will serve as the foundation for being able to measure and optimize your growth acquisition efforts. Your reporting will involve data from multiple platforms like ad publishers, analytics platforms, and CRMs, but ultimately one of those platforms should serve as the source of truth for measuring your growth marketing efforts at this stage. While ad networks have the ability to track and measure KPIs they typically have the limitation of capturing data for only their network and lack the ability to track the LTV of a user. Product analytics and mobile measurement partner tools are an improvement over ad networks because of their ability to report in an unbiased manner but are also limited in measuring LTV and serving as a central repository of your business logic. Despite the latter limitations, they can easily serve as a good baseline around the immediate impact of your growth acquisition efforts. What that leaves you with are CDPs/CRMs or backend systems that are customizable and carry a wide range of benefits like tracking attribution in an unbiased and personalized way, capturing LTV, and easily giving you the ability to snapshot and segment customers by product usage not easily tracked by the methods previously mentioned.
While I have outlined that some platforms are better than others at this phase, they are all still connected in one shape or another and require data unification to paint the full picture of the effectiveness of your growth efforts. Backend systems still need an attribution system that can be provided by analytics tools and reporting isn’t complete without understanding the customer acquisition cost associated with our marketing efforts that utilize publisher metrics.
With a source of truth in place, it's time to talk about data unification. As I stated at the start of this section, the focus is on simplicity. While you will shriek at my suggestion, the easiest place to unify this data to start with is in a spreadsheet. It is a tool that everyone is familiar with and can contribute to and you have full control over how the data will be merged together. By no means is it pretty or scalable but it does the job and can carry you a long way and give you a baseline understanding of where and how your customers convert.
Phase 2
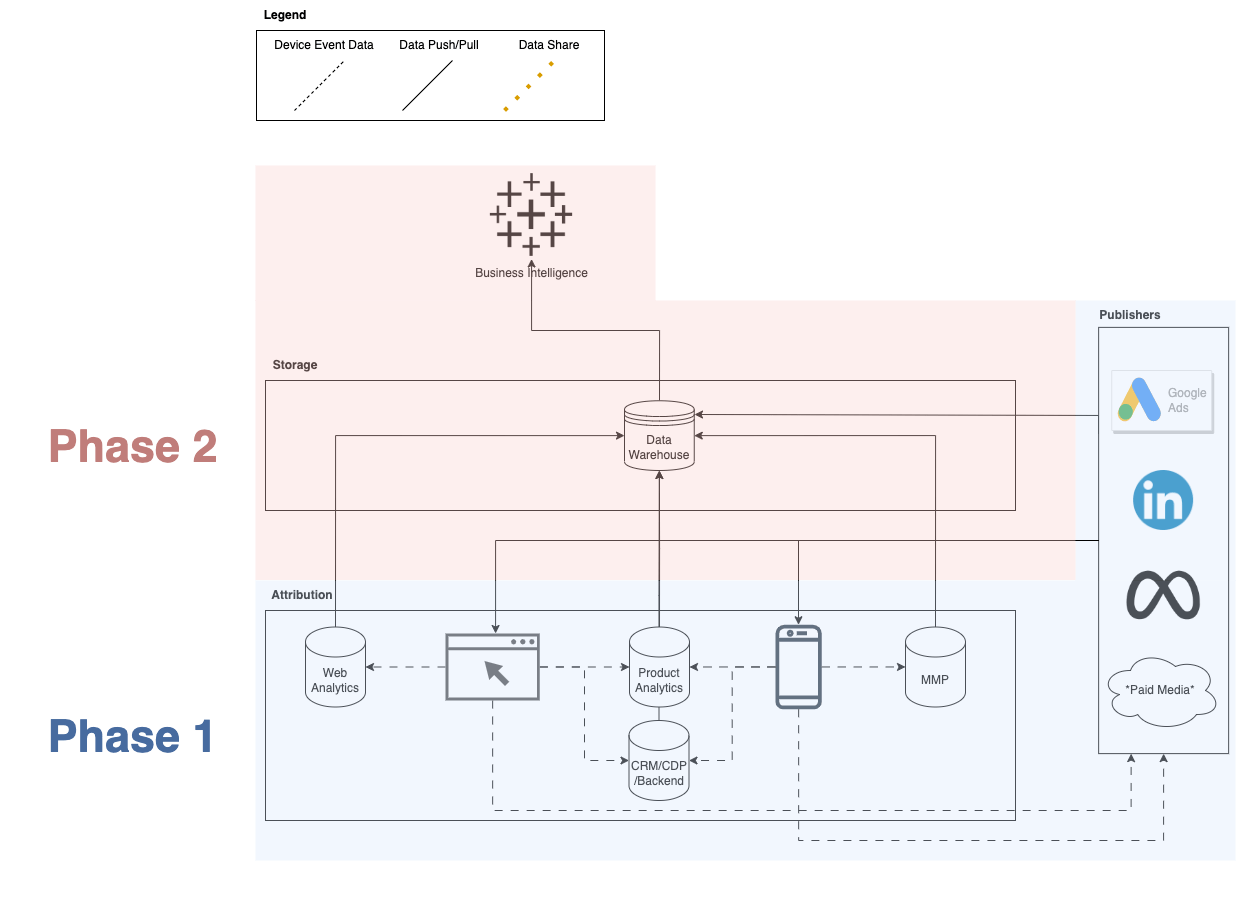
With attributable reporting in place, the next goal is to streamline and improve the reporting process by focusing on data storage, unification, and finding a business intelligence tool. If you are considering the tools in this phase, then it likely means that you have hit some efficiency bottlenecks, scaled up your growth efforts beyond a few channels, increased headcount, or continue to experience analysis paralysis. Where to begin in fixing these issues is coming up with a data warehouse and unification strategy. While many organizations may hand this task to an inexperienced person, it is extremely important that you have someone lead who has done it before or outsource the job to experts to handle the initial architecture. There are many tools and philosophies you can follow when setting up data warehouses and as someone who has witnessed the impact poor architectures have on an organization, I will only say that you will not want to face the costs associated with making mistakes with this implementation as it will continue to bleed a company as the years go on.
Once you have a data strategy in place, a decision should be made regarding a business intelligence tool. Like the data strategy decision, this tool selection should check the boxes of larger organizational needs. It is likely the driver of this conversation stems from your organization's recognition of the lack of defined and structured business data and has come up against the feature limitations of a spreadsheet. While you will likely never end up ditching spreadsheets, a business intelligence tool will provide you with more power and automation capabilities that will help streamline insights gathering and data analysis.
I find that the important characteristics of a good business intelligence tool are customization and power. Customization because your organization's business needs are unique and will not fit the mold of business intelligence tools that are rigid in their flexibility to adapt to all customer's needs. Power because you want to be able to explore and extract insights in short periods of time in a manner that empowers all users to be able to do so. This should be something that allows for the utilization of SQL and excel-like functions to adapt the tool to all business needs in a user-friendly environment. It should allow users to create visualizations and set up automation and alerts that cut down on report building and drive more focus on strategy and tactic optimization. By focusing on a product that has both of these characteristics, you will not only find improvements to your reporting capabilities but also have a scalable solution that will likely be able to adapt to your company’s growing business needs.
Phase 3
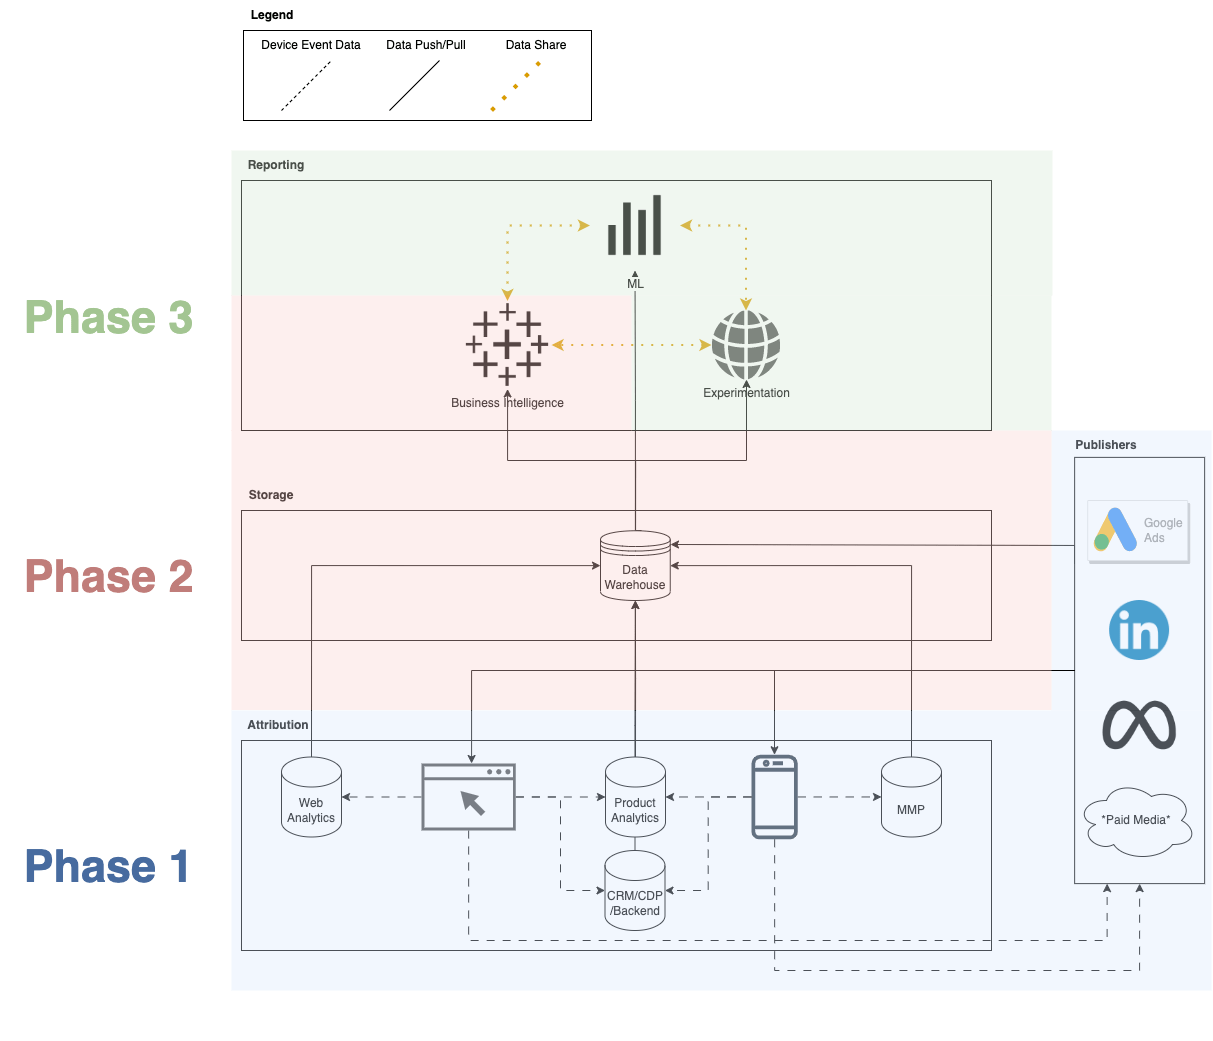
If you have made it this far, then pat yourself on the back! From my experience, I have only met a handful of companies that have gotten this far. While most will likely be content with their infrastructure by this point, those who understand the limitations and errors associated with only relying on baseline reporting will push for incorporating machine learning and experimentation into their measurement stack. However, successfully adopting these tools is tricky to achieve because it requires the organizational buy-in of a new reporting methodology and data science/engineering resources that will be costly.
Organizations are very comfortable with making decisions based on what their “source of truth” attribution platform tells them because the methodology is tangible and universally accepted in most business reporting. The incorporation of statistical models and experimentation into the fold will always result in outputs that conflict with what was previously believed to be “truths” communicated by platform reporting. It is paramount that the results from these tools are utilized and compared against these truths. These scientific approaches go beyond the flawed tracking capabilities found in baseline reporting and better inform us of the relationships our growth efforts are having on the bottom line.
In order to successfully do this, you need organizational buy-in that more than one tool is required to measure growth effectiveness and improve the strategy and tactics taken to scale your growth program. Your business will be better off by adopting these tools for decision-making, but it is easier said than done, so find your advocates and be prepared to make your argument for bringing these tools into your reporting stack.
Once you have that buy-in, there will likely be various tools and techniques deployed ranging from simple regression analysis and customer segmentation to more involved causal inference projects like marketing mix model, geo experimentation, and propensity scoring. What tools you should use should cater to your business needs and evolve over time as your growth program changes. The dynamic nature of the tools utilized in this phase means that it is paramount that the data architecture in phase 2 supports these tools and streamlines the tool adoption process of test, deployment, and automation.
Slow and Steady Wins the Race
Growth analytics architecture is by no means one size fits all. The phased approach I have walked you through above is based on my years of experience building data infrastructures for various companies. It won’t be perfect for all operations but is a good foundational guide on how you should think about your infrastructure without the noise of all of the data/MarTech products that exist. While those products can be helpful over time, without a foundation of tried and true tools in place you are bound to hit bottlenecks. This process requires time, patience, and careful consideration, but ultimately yields a scalable and effective growth analytics infrastructure.